Documentation for ixdat
Welcome to ixdat - The in-situ experimental data tool
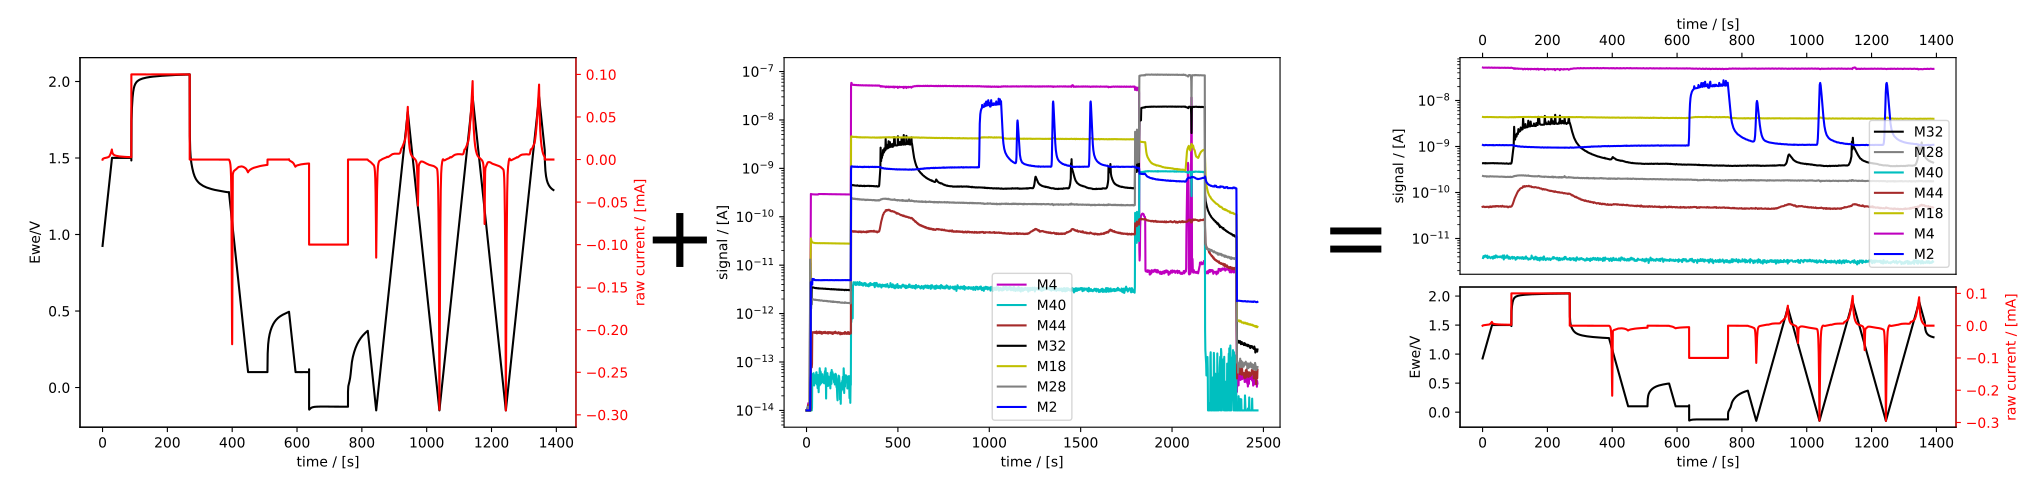
With ixdat, you can import, combine, and export complex experimental datasets
as simply as:
ec = Measurement.read_set("awesome_EC_data", reader="biologic")
ec.plot_measurement()

ms = Measurement.read("2021-03-30 16_59_35 MS data.tsv", reader="zilien")
ms.plot_measurement()

ecms = ec + ms
ecms.plot_measurement()

ecms.export("my_combined_data.csv")
Output:
In-situ experimental data made easy
Or rather than exporting, you can take advantage of ixdat’s powerful analysis
tools and database backends to be a one-stop tool from messy raw data to public
repository accompanying your breakthrough publication and advancing our field.
This documentation page is structured as follows: The Introduction gives a brief intro to the concept and has a list of the techniques and file types supported so far. In Getting started you have the info on how to install ixdat on your computer, as well as several tutorials guiding you through ixdat’s vast possibilities. If you want to know more about the concept, or check out the in-depth code documentation, check out Diving deeper. And finally, if you want to contribute to our open-source project, find out more at Developing ixdat.
If you have any feedback, comments or questions, find out how to contact the ixdat team here: FAQ.
This documentation, like ixdat itself, is a work in progress and we appreciate any feedback or requests.