Tutorial: Spectroelectrochemistry data
Data required: available for download here
This example data comes from Caiwu Liang, et al. Unravelling the effects of active site densities and energetics on the water oxidation activity of iridium oxides https://doi.org/10.21203/rs.3.rs-2605628/v1
The data
To run this tutorial, save the data somewhere on you computer and modify the data_dir variable below accordingly. The code in the following lines should then print a list of the data folder contents including several .csv’s
[1]:
from pathlib import Path

data_dir = Path.home() / "Dropbox/ixdat_resources/test_data/sec"

print("data directory containes files and folders:")
for path in data_dir.iterdir():
    print(path)
data directory containes files and folders:
C:\Users\Søren\Dropbox\ixdat_resources\test_data\sec\decay
C:\Users\Søren\Dropbox\ixdat_resources\test_data\sec\sec_decay_export.csv
C:\Users\Søren\Dropbox\ixdat_resources\test_data\sec\sec_decay_export_reference.csv
C:\Users\Søren\Dropbox\ixdat_resources\test_data\sec\sec_decay_export_spectra.csv
C:\Users\Søren\Dropbox\ixdat_resources\test_data\sec\sec_export.csv
C:\Users\Søren\Dropbox\ixdat_resources\test_data\sec\sec_export_reference.csv
C:\Users\Søren\Dropbox\ixdat_resources\test_data\sec\sec_export_spectra.csv
C:\Users\Søren\Dropbox\ixdat_resources\test_data\sec\test-2SEC.csv
C:\Users\Søren\Dropbox\ixdat_resources\test_data\sec\test-2_JV.csv
C:\Users\Søren\Dropbox\ixdat_resources\test_data\sec\test-7SEC.csv
C:\Users\Søren\Dropbox\ixdat_resources\test_data\sec\test-7_JV.csv
C:\Users\Søren\Dropbox\ixdat_resources\test_data\sec\WL.csv
SEC while scanning potential
[2]:
from ixdat import Measurement

sec = Measurement.read(
    data_dir / "test-7SEC.csv",
    path_to_ref_spec_file = data_dir / "WL.csv",
    path_to_U_J_file = data_dir / "test-7_JV.csv",
    scan_rate=1,
    tstamp=1,
    reader="msrh_sec"
)
importing ixdat v0.2.7.dev1 from C:\Users\Søren\git\ixdat\src\ixdat\__init__.py
C:\Users\Søren\git\ixdat\src\ixdat\techniques\analysis_tools.py:92: RuntimeWarning: invalid value encountered in divide
  v_scan_behind = (v - v_behind) / (t - t_behind)
C:\Users\Søren\git\ixdat\src\ixdat\techniques\analysis_tools.py:93: RuntimeWarning: invalid value encountered in divide
  v_scan_ahead = (v_ahead - v) / (t_ahead - t)
[3]:
sec.plot_measurement()
C:\Users\Søren\git\ixdat\src\ixdat\plotters\base_mpl_plotter.py:61: MatplotlibDeprecationWarning: Auto-removal of overlapping axes is deprecated since 3.6 and will be removed two minor releases later; explicitly call ax.remove() as needed.
  axes = [plt.subplot(gs[0:3, 0])]
[3]:
[<Axes: xlabel='time from scan rate', ylabel='wavelength / [nm]'>,
 <Axes: xlabel='time / [s]', ylabel='raw potential / [V]'>,
 None,
 <Axes: ylabel='raw current / [mA]'>]

The raw data as numpy arrays is accessible as such:
[4]:
wavelength = sec.wavelength.data
absorption_matrix = sec.spectra.data
potential = sec.potential.data

print("wavelength:")
print(wavelength)

print("potential:")
print(potential)

print("absorption:")
print(absorption_matrix)
wavelength:
[450.58331 451.00531 451.42731 ... 873.6803  874.08472 874.48907]
potential:
[0.4   0.401 0.402 ... 1.497 1.498 1.499]
absorption:
[[ 5488.33333333  5501.93333333  5505.3        ... 37897.93333333
  37868.56666667 37805.83333333]
 [ 5483.          5502.46666667  5506.03333333 ... 37881.4
  37856.7        37809.46666667]
 [ 5490.76666667  5503.96666667  5512.33333333 ... 37871.8
  37863.53333333 37794.2       ]
 ...
 [ 3931.63333333  3948.23333333  3949.2        ... 24453.6
  24418.23333333 24395.86666667]
 [ 3927.7         3946.86666667  3950.8        ... 24414.76666667
  24387.76666667 24382.2       ]
 [ 3934.56666667  3939.53333333  3941.83333333 ... 24411.1
  24383.86666667 24374.16666667]]
[5]:
sec.calibrate_RE(RE_vs_RHE=0.26)
sec.normalize_current(A_el=1)
sec.plot_measurement(make_colorbar=True)
C:\Users\Søren\git\ixdat\src\ixdat\plotters\plotting_tools.py:50: MatplotlibDeprecationWarning: The get_cmap function was deprecated in Matplotlib 3.7 and will be removed two minor releases later. Use ``matplotlib.colormaps[name]`` or ``matplotlib.colormaps.get_cmap(obj)`` instead.
  cmap = mpl.cm.get_cmap(cmap_name)
[5]:
[<Axes: xlabel='time from scan rate', ylabel='wavelength / [nm]'>,
 <Axes: xlabel='time / [s]', ylabel='$U_{RHE}$ / [V]'>,
 None,
 <Axes: ylabel='J / [mA cm$^{-2}$]'>]

[6]:
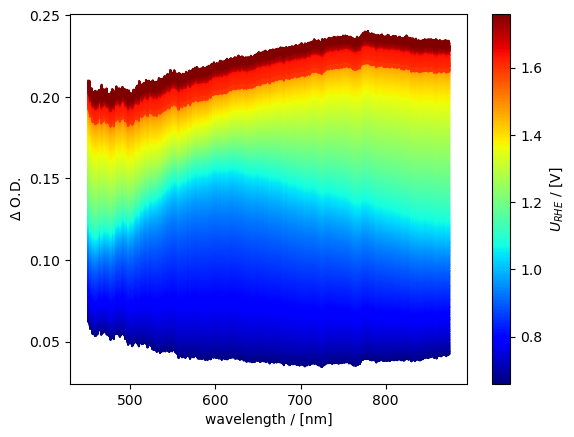
sec.plot_waterfall()
C:\Users\Søren\git\ixdat\src\ixdat\plotters\spectrum_plotter.py:192: MatplotlibDeprecationWarning: The get_cmap function was deprecated in Matplotlib 3.7 and will be removed two minor releases later. Use ``matplotlib.colormaps[name]`` or ``matplotlib.colormaps.get_cmap(obj)`` instead.
  cmap = mpl.cm.get_cmap(cmap_name)
[6]:
<Axes: xlabel='wavelength / [nm]', ylabel='$\\Delta$ O.D.'>
[7]:
sec.reference_spectrum.plot()
[7]:
<Axes: xlabel='wavelength / [nm]', ylabel='reference'>

[8]:
sec.set_reference_spectrum(V_ref=0.66)
sec.reference_spectrum.plot()
[8]:
<Axes: xlabel='wavelength / [nm]', ylabel='spectra_0.66V'>

[9]:
# help(sec)  # useful but very long output. Shows for example, that the following gives delta OD data:
delta_OD_data = sec.calc_dOD().data
print(delta_OD_data)  # A 2-D numpy array.
[[-0.00000000e+00 -0.00000000e+00 -0.00000000e+00 ... -0.00000000e+00
  -0.00000000e+00 -0.00000000e+00]
 [ 4.22234445e-04 -4.20965657e-05 -5.78463318e-05 ...  1.89506432e-04
   1.36113826e-04 -4.17359084e-05]
 [-1.92508176e-04 -1.60471285e-04 -5.54481744e-04 ...  2.99580384e-04
   5.77284638e-05  1.33658473e-04]
 ...
 [ 1.44867472e-01  1.44112513e-01  1.44271862e-01 ...  1.90272724e-01
   1.90564628e-01  1.90242564e-01]
 [ 1.45302172e-01  1.44262868e-01  1.44095945e-01 ...  1.90962949e-01
   1.91106836e-01  1.90485926e-01]
 [ 1.44543572e-01  1.45070544e-01  1.45082732e-01 ...  1.91028178e-01
   1.91176292e-01  1.90629039e-01]]
[10]:
sec.plot_waterfall()
[10]:
<Axes: xlabel='wavelength / [nm]', ylabel='$\\Delta$ O.D.'>

[11]:
axes = sec.plot_measurement(cmap_name="jet")
axes[0].set_xlabel("time / [s]")
[11]:
Text(0.5, 0, 'time / [s]')

[12]:
sec.plot_vs_potential()
[12]:
[<Axes: xlabel='$U_{RHE}$ / [V]', ylabel='wavelength / [nm]'>,
 <Axes: xlabel='$U_{RHE}$ / [V]', ylabel='J / [mA cm$^{-2}$]'>]

[13]:
sec.plot_vs_potential(cmap_name="jet")

axes = sec.plot_vs_potential(cmap_name="jet", vspan=[1.0, 1.45], make_colorbar=True, color="g")
axes[1].set_ylim([0, 0.1])
[13]:
(0.0, 0.1)


[14]:
sec.plot_wavelengths(wavelengths=["w800", "w580"])
C:\Users\Søren\git\ixdat\src\ixdat\plotters\sec_plotter.py:365: MatplotlibDeprecationWarning: The get_cmap function was deprecated in Matplotlib 3.7 and will be removed two minor releases later. Use ``matplotlib.colormaps[name]`` or ``matplotlib.colormaps.get_cmap(obj)`` instead.
  cmap = mpl.cm.get_cmap(cmap_name)

[15]:
sec.plot_wavelengths_vs_potential(wavelengths=["w800", "w580", "w480"])
C:\Users\Søren\git\ixdat\src\ixdat\plotters\sec_plotter.py:412: MatplotlibDeprecationWarning: The get_cmap function was deprecated in Matplotlib 3.7 and will be removed two minor releases later. Use ``matplotlib.colormaps[name]`` or ``matplotlib.colormaps.get_cmap(obj)`` instead.
  cmap = mpl.cm.get_cmap(cmap_name)

[16]:
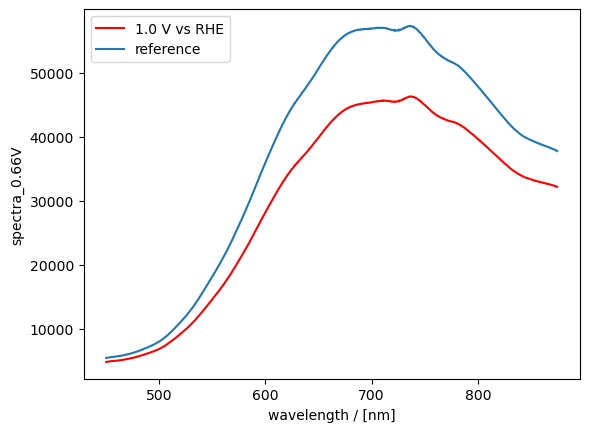
spec_1 = sec.get_spectrum(V=1.0)

ax = spec_1.plot(color="r", label="1.0 V vs RHE")
sec.reference_spectrum.plot(ax=ax, label="reference")
ax.legend()
[16]:
<matplotlib.legend.Legend at 0x1bfdddb1590>
[17]:
spec_1 = sec.get_dOD_spectrum(V=1.0, V_ref=0.66)
spec_1.plot()
[17]:
<Axes: xlabel='wavelength / [nm]', ylabel='$\\Delta$ OD'>

[18]:
ax = sec.get_dOD_spectrum(V=1.0, V_ref=0.66).plot(color="b", label="species 1")
sec.get_dOD_spectrum(V=1.4, V_ref=1.0).plot(color="g", label="species 2", ax=ax)
sec.get_dOD_spectrum(V=1.7, V_ref=1.4).plot(color="r", label="species 3", ax=ax)
ax.legend()
[18]:
<matplotlib.legend.Legend at 0x1bfe318f810>

[19]:
sec.export(data_dir / "sec_export.csv")

print(sec.reference_spectrum.name)
wrote C:\Users\Søren\Dropbox\ixdat_resources\test_data\sec\sec_export_spectra.csv!
wrote C:\Users\Søren\Dropbox\ixdat_resources\test_data\sec\sec_export_reference.csv!
writing C:\Users\Søren\Dropbox\ixdat_resources\test_data\sec\sec_export.csv!
spectra_0.66V
[20]:
sec_reloaded = Measurement.read(data_dir / "sec_export.csv", reader="ixdat")

sec_reloaded.set_reference_spectrum(V_ref=0.66)

sec_reloaded.plot_vs_potential(cmap_name="jet")
skipping the following line:
ixdat version = 0.2.7.dev1

skipping the following line:
backend_name = BackendBase(none, address=none)

skipping the following line:
backend_name = BackendBase(none, address=none)

skipping the following line:
backend_name = BackendBase(none, address=none)
C:\Users\Søren\git\ixdat\src\ixdat\plotters\base_mpl_plotter.py:61: MatplotlibDeprecationWarning: Auto-removal of overlapping axes is deprecated since 3.6 and will be removed two minor releases later; explicitly call ax.remove() as needed.
  axes = [plt.subplot(gs[0:3, 0])]
[20]:
[<Axes: xlabel='$U_{RHE}$ / [V]', ylabel='wavelength / [nm]'>,
 <Axes: xlabel='$U_{RHE}$ / [V]', ylabel='J / [mA cm$^{-2}$]'>]

[21]:
[(s.name, s.shape) for s in sec_reloaded.series_list]
[21]:
[('time from scan rate', (1100,)),
 ('$U_{RHE}$ / [V]', (1100,)),
 ('J / [mA cm$^{-2}$]', (1100,)),
 ('selector', (1100,)),
 ('w800', (1100,)),
 ('w580', (1100,)),
 ('w480', (1100,))]
Open-circuit potential decay
[22]:
sec_decay = Measurement.read(
    data_dir / "decay/PDtest-1.35-1OSP-SP.csv",
    path_to_ref_spec_file=data_dir / "WL.csv",
    path_to_t_U_file=data_dir / "decay/PDtest-1.35-1OSP-E-t.csv",
    path_to_t_J_file=data_dir / "decay/PDtest-1.35-1OSP-J-t.csv",
    tstamp=1,
    reader="msrh_sec_decay",
)
[23]:
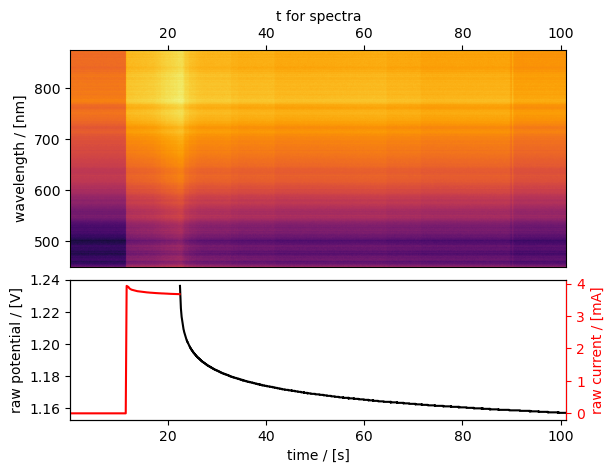
sec_decay.plot_measurement()
C:\Users\Søren\git\ixdat\src\ixdat\plotters\base_mpl_plotter.py:61: MatplotlibDeprecationWarning: Auto-removal of overlapping axes is deprecated since 3.6 and will be removed two minor releases later; explicitly call ax.remove() as needed.
  axes = [plt.subplot(gs[0:3, 0])]
[23]:
[<Axes: xlabel='t for spectra', ylabel='wavelength / [nm]'>,
 <Axes: xlabel='time / [s]', ylabel='raw potential / [V]'>,
 None,
 <Axes: ylabel='raw current / [mA]'>]
[24]:
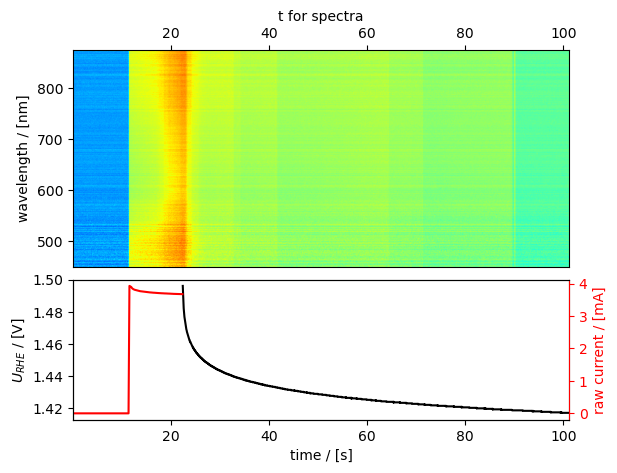
sec_decay.calibrate_RE(RE_vs_RHE=0.26)
sec_decay.set_reference_spectrum(t_ref=5)
sec_decay.plot_measurement(cmap_name="jet")
[24]:
[<Axes: xlabel='t for spectra', ylabel='wavelength / [nm]'>,
 <Axes: xlabel='time / [s]', ylabel='$U_{RHE}$ / [V]'>,
 None,
 <Axes: ylabel='raw current / [mA]'>]
[25]:
sec_decay.plot_wavelengths(wavelengths=["w480", "w600", "w850"])
C:\Users\Søren\git\ixdat\src\ixdat\plotters\sec_plotter.py:365: MatplotlibDeprecationWarning: The get_cmap function was deprecated in Matplotlib 3.7 and will be removed two minor releases later. Use ``matplotlib.colormaps[name]`` or ``matplotlib.colormaps.get_cmap(obj)`` instead.
  cmap = mpl.cm.get_cmap(cmap_name)

[26]:
sec_decay.export(data_dir / "sec_decay_export.csv")
wrote C:\Users\Søren\Dropbox\ixdat_resources\test_data\sec\sec_decay_export_spectra.csv!
wrote C:\Users\Søren\Dropbox\ixdat_resources\test_data\sec\sec_decay_export_reference.csv!
writing C:\Users\Søren\Dropbox\ixdat_resources\test_data\sec\sec_decay_export.csv!